Trading & Stock Market Basics
Top Mistakes to Avoid When Trading the Double Top Pattern
Dec 14, 2025
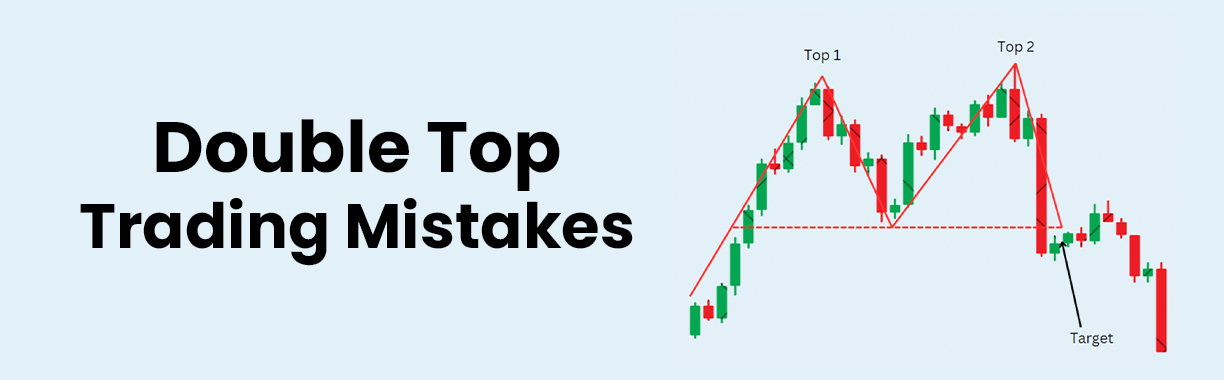
Chart patterns can help traders understand potential market turning points, and the double top pattern is a widely recognised reversal formation. It often appears after a sustained uptrend and may indicate that buying pressure is weakening. While the pattern is simple in structure, many traders misinterpret or mismanage it, leading to avoidable losses. Understanding these common mistakes can help you read market signals more clearly and approach the double top pattern with greater discipline.
Below are the key errors traders tend to make, and how you can steer clear of them.
1. Entering the Trade Too Early
One of the most frequent mistakes is assuming that the double top pattern is confirmed the moment the second high forms. In reality, the pattern becomes valid only when the price breaks below the "neckline, which is the low between the two tops.
For example, consider a stock that rises to ₹210 twice but finds support at ₹195. If the price touches ₹210 the second time and immediately begins to fall, it may look like a completed pattern. But unless it breaks below ₹195, the price is still within its previous trading range. Entering before the neckline breaks can lead to traders exiting by acting in fear.
Tip: You can wait for a decisive close below the neckline before treating the setup as a confirmed reversal.
2. Ignoring Market Context
A double top pattern should never be analysed in isolation from the pattern. You should look at the market conditions, such as broader economic trends, sector performance, or high- impact news, which can alter how reliable the formation is.
For instance, during a period of strong market optimism, prices may breach the second top only briefly before continuing their upward momentum. Similarly, in a highly volatile market, the price may oscillate near the pattern's key levels, making it difficult to validate. Tip: Use wider market cues and other indicators to support your view. A pattern that is backed by broader market weakness tends to be reliable.
3. Overlooking Volume Confirmation
Volume is often overlooked when analysing chart patterns. In many cases, the second peak of a double top pattern forms with lower trading volume compared to the first peak. These reduced strength signals diminish buying interest.
If the second top forms with unusually high volume, the pattern may not be reliable and could even suggest renewed bullish activity. Similarly, the decline through the neckline should ideally be accompanied by increased volume to confirm that sellers are taking control.
Tip: Combine the double top technical analysis with volume cues for stronger confirmation.
4. Placing Stop-Loss Levels Too Tight or Too Loose
Poor stop-loss placement is another mistake. Traders often put stop-loss levels exactly at the second top, which can result in quick exits due to normal market noise. On the other hand, placing stops too far above the top may expose the trader to unnecessary risk.
When you have a reasonable buffer above the second peak, help to accommodate any minor fluctuations while still protecting you from pattern failure.
Example: If the second top forms at ₹210, placing a stop-loss slightly above that, rather than at ₹210 exactly, helps avoid being taken out by small spikes.
5. Ignoring False Breakouts
False breakouts occur when the price briefly moves above the second peak, causing some traders to think the pattern is invalid. However, such movement may be temporary. Jumping out too soon can cause traders to miss the opportunity if the reversal eventually plays out. Recognising the difference between a true breakout and a short-lived price spike is essential, especially in volatile markets.
Tip: You should monitor the price closings and not just the day changes.
6. Relying Solely on the Pattern
While the double top pattern is a popular reversal signal, relying on it alone can lead to you making flawed decisions. Traders who use only chart formations without considering momentum indicators or market structure may misjudge the strength of the setup.
When you look at indicators like RSI, MACD or moving averages can help validate if the upward trend is genuinely losing strength or if it is just a temporary stall.
Tip: Treat the double top chart pattern as one piece of a wider analytical approach.
7. Poor Risk-Reward Planning
Some traders overlook risk-reward ratios when applying a double top trading strategy. Even if the pattern is correctly identified, entering without a clear exit plan can cause the trade to tilt unfavourably.
For example, a trader may enter at the neckline break but set a target too close, limiting potential gains, or set it too far, reducing the chances of being achieved. Tip: Map out potential targets using the height of the pattern, market structure, and key support zones.
Conclusion
The double top pattern can be a helpful reversal formation when used alongside proper confirmation, context and risk management. You can make mistakes if you are impatient, overconfident, or analysing the pattern in isolation. If you wait for neckline breaks, monitoring volume, and using additional indicators, traders can interpret the pattern effectively. You must staying disciplined and objective is when navigating such chart formations. For more such blog on stock marketing trading, you can check out Indiabulls Securities Limited.
FAQs
1. How is the double top pattern different from other reversal patterns?
A double top typically forms two distinct highs at similar levels, whereas other reversal patterns, like head and shoulders or triple tops, have complex structures.
2. Can a double top form on intraday charts?
Yes, the double top form can appear on any timeframe. However, shorter timeframes may see more false signals due to the faster fluctuations.
3. What if the price rises above the second top briefly?
A brief move above the second peak does not automatically invalidate the pattern. Traders often wait for sustained closes above the level before considering the reversal invalid.
4. Is volume always necessary to confirm the pattern?
While helpful, volume is not an absolute requirement. It strengthens the analysis, but should be used along with other indicators and the market context.
Disclaimer: The contents herein are only for information and do not amount to an offer, invitation or solicitation to buy or sell securities or any other financial product offered by Indiabulls Securities Limited (formerly Dhani Stocks Limited / DSL). The content mentioned herein is subject to updation, completion, amendment without notice and is not intended for distribution to, or use by, any person in any jurisdiction where such distribution or use would be contrary to law or would subject Indiabulls Securities Ltd. (formerly Dhani Stocks Ltd. / DSL) to any licensing or registration requirements. No content mentioned herein is intended to constitute any investment advice or opinion. ISL disclaims any liability with respect to accuracy of information or any error or omission or any loss or damage incurred by anyone in reliance on the contents herein. This blog is based on information obtained from public sources and sources believed to be reliable, but no independent verification has been made about its accuracy or its completeness is guaranteed. This content mentioned in this blog is solely for informational purpose and shall not be used and/or considered as an offer or invitation or solicitation to buy or sell securities or other financial instruments. ISL will not treat recipients as customers by virtue of their receiving this report. The securities / Mutual Fund units (if any) discussed and opinions expressed in this blog/report may not be suitable for all investors. Such investors must make their own investment decisions, based on their investment objectives, financial positions and specific needs. ISL accepts no liabilities whatsoever for any loss or damage of any kind arising out of the use of this report. Past performance is not necessarily a guide to future performance. Investors are advised to see Risk Disclosure Document to understand the risks associated before investing in the securities markets. ISL may have issued other blogs that are inconsistent with and reach different conclusion from the information presented in this blog.
Indiabulls Securities Limited (formerly Dhani Stocks Limited) is a Mutual Fund Distributor registered with ‘Association of Mutual Fund of India’ (AMFI) vide ARN number ARN-160411. Corporate Identification Number: U74999DL2003PLC122874; Registered office address: A-2, First Floor, Kirti Nagar, New Delhi - 110008. Tel.: 011-41052775, Fax: 011-42137986.; Correspondence office address: Plot no. 108, 5th Floor, IT Park, Udyog Vihar, Phase - I, Gurugram - 122016, Haryana. Tel: 022-61446300. Email: helpdesk@indiabulls.com